The Evolution of the World Map: An Inventive Infographic Shows How Our Picture of the World Changed Over 1,800 Years
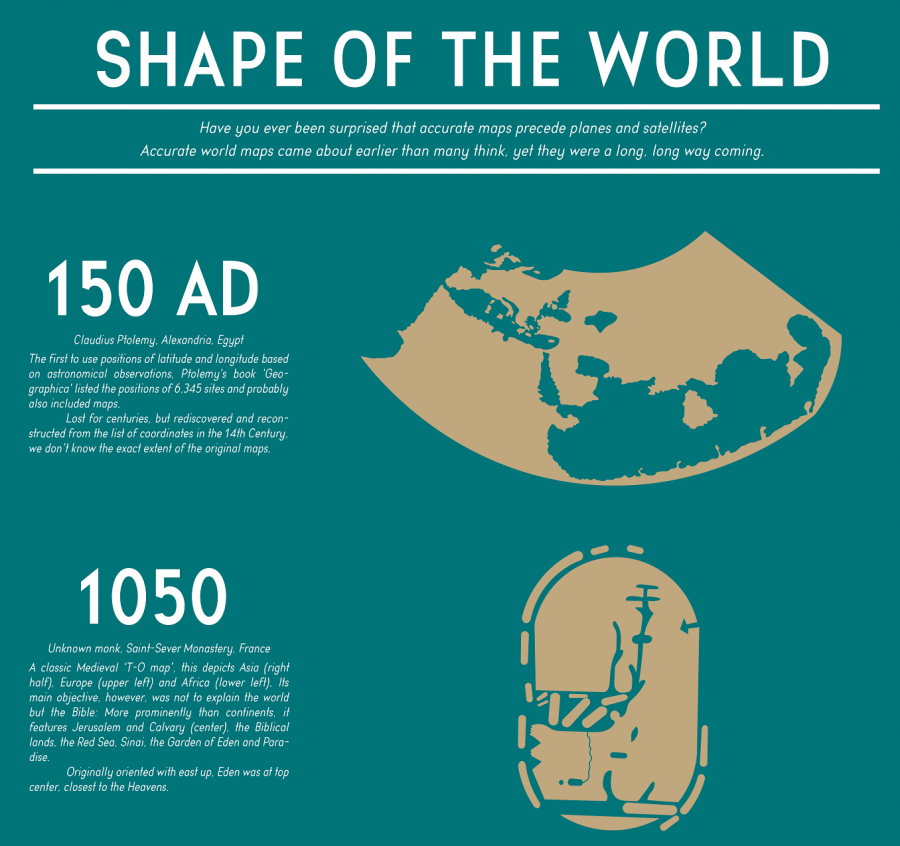
For about 190 years, humanity has known what the world looks like. Or rather, humanity has known the shape and size of the land masses that rise up above the oceans, as well as where those land masses stand in relation to one another. For generation upon generation, we've all grown up seeing visual depictions of this knowledge in the form of the standard world map — distorted, of course, usually by Mercator projection, given the impossibility of turning a three-dimensional globe into a two-dimensional image with perfect accuracy. We can call it to mind (or up on our phones) whenever we need it. But what did the world look like before we knew what it looked like? Thanks to a Redditor who goes by PisseGuri82, we can now take in, at a glance, humanity's image of the world as it evolved over the past two millennia.
This Shape of the World infographic begins in 150 AD with the world map used by Claudius Ptolemy of Alexandria, Egypt, "the first to use positions of latitude and longitude based on astronomical observations." Not that those observations produced anything immediately resembling an ancestor of the map we remember from classroom walls growing up, but it certainly must have marked an improvement on the guesswork and pure fantasy used in even earlier times.
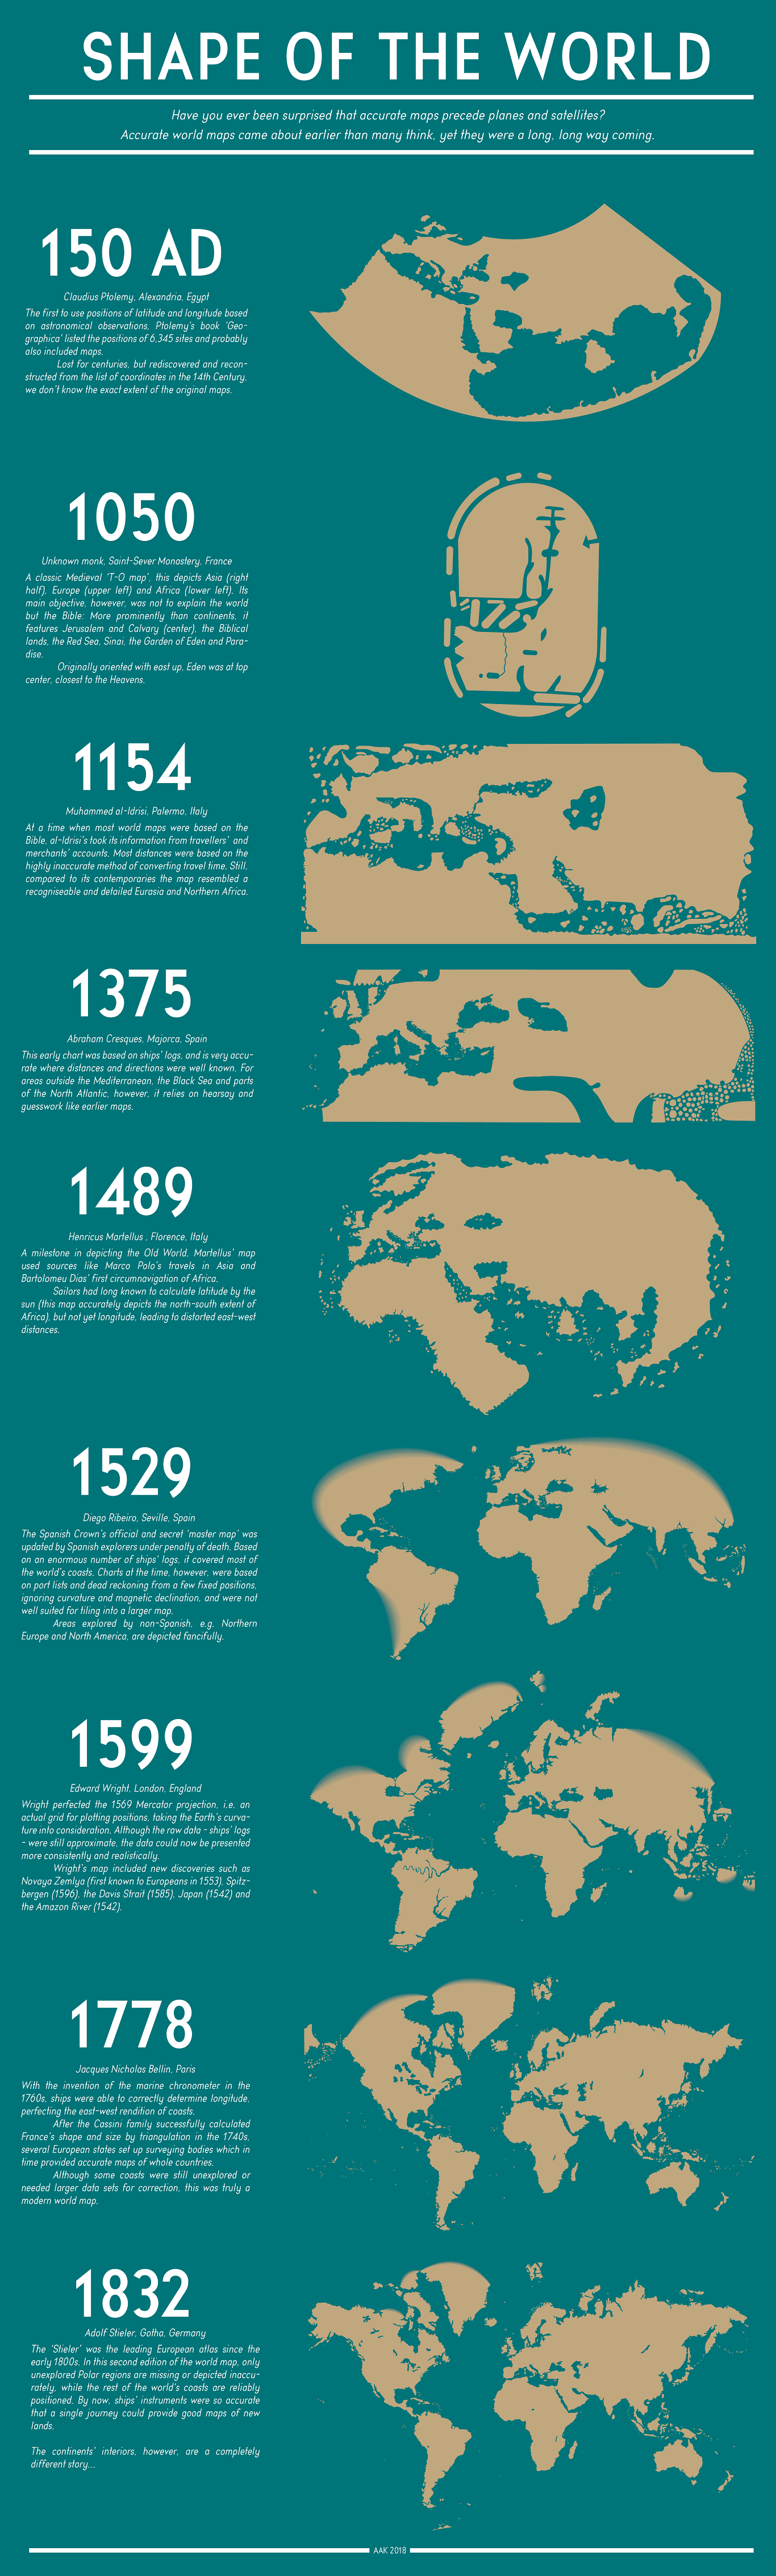
World maps from the medieval period, such as the one included on the diagram created by an unknown French monk in 1050, were meant "not to explain the world but the Bible." Hence its focus on such Biblical parts of the world as Jerusalem, the Red Sea, and even the Garden of Eden.
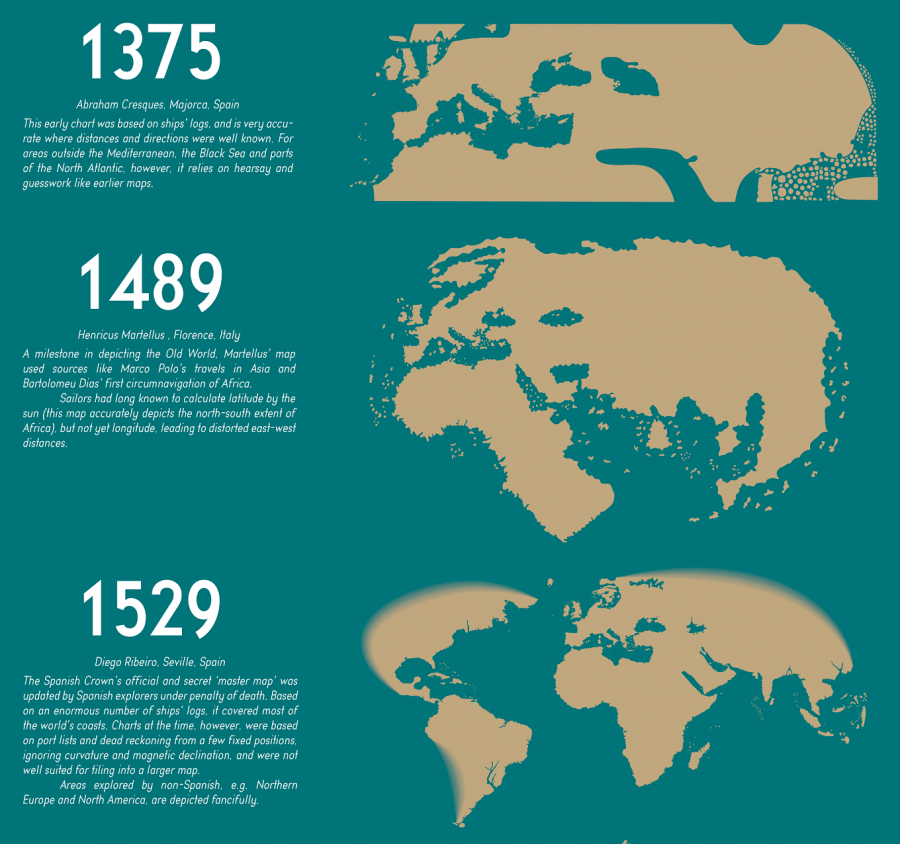
Just over a century later, a map by Italy's Muhammed al-Idrisi employed the more objective method of calculating distances by what travelers and merchants told him about how long it took them to reach the distant lands they visited. Despite its "recognizable and detailed Eurasia and Northern Africa," however, it still makes for a vague (and, needless to say, hardly complete) approximation of the world. Only in 1529, with the empire-minded Spanish Crown's official and secret "master map," updated "by Spanish explorers on pain of death," do we arrive at a world map that would remind any of us of the ones we use in the 21st century.
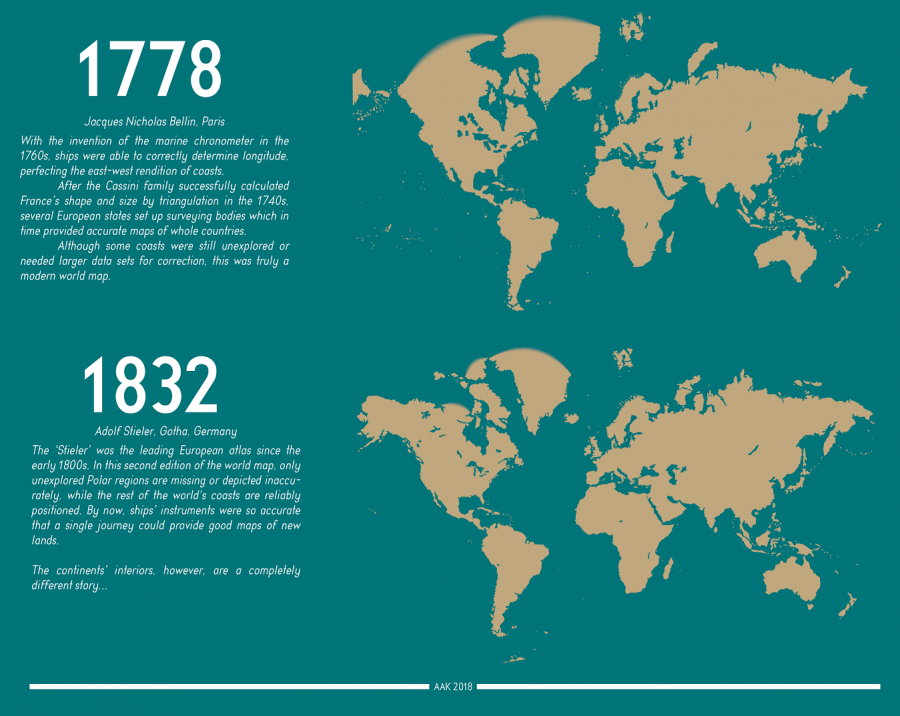
Subsequent developments came from such advances as the aforementioned Mercator projection, invented in 1569 in the Netherlands and refined in England 30 years later, as well as the invention of the marine chronometer in 1778. The final map in the chart, an 1832 edition by Germany's Adolf Stieler in which "only the unexplored Polar regions are missing or depicted inaccurately," may look almost exactly like the world maps we use today. But the evolution certainly hasn't stopped: with the ever more detailed digital maps and satellite imagery that now feature in our world maps, our ability to perceive the Earth still improves every day. Our descendants 2000 years hence may well place themselves in a world we would hardly recognize. See the full-size "Shape of the World" infographic here. Make sure you click on the image once you open the page, and then you can see it in a larger format.
Related Content:
Animated Maps Reveal the True Size of Countries (and Show How Traditional Maps Distort Our World)
Japanese Designers May Have Created the Most Accurate Map of Our World: See the AuthaGraph
The History of Cartography, the “Most Ambitious Overview of Map Making Ever,” Now Free Online
A Radical Map Puts the Oceans – Not Land – at the Center of Planet Earth (1942)
Why Making Accurate World Maps Is Mathematically Impossible
Based in Seoul, Colin Marshall writes and broadcasts on cities, language, and culture. His projects include the book The Stateless City: a Walk through 21st-Century Los Angeles and the video series The City in Cinema. Follow him on Twitter at @colinmarshall, on Facebook, or on Instagram.
The Evolution of the World Map: An Inventive Infographic Shows How Our Picture of the World Changed Over 1,800 Years is a post from: Open Culture. Follow us on Facebook, Twitter, and Google Plus, or get our Daily Email. And don't miss our big collections of Free Online Courses, Free Online Movies, Free eBooks, Free Audio Books, Free Foreign Language Lessons, and MOOCs.


from Open Culture https://ift.tt/2YOxaG3
via Ilumina
Comments
Post a Comment