Behold the New York City Street Tree Map: An Interactive Map That Catalogues the 700,000 Trees Shading the Streets of New York City
It may sound odd, but one of the things I miss most about living in New York City is the ability to hop on a bus or train, or walk a few blocks from home, and end up lounging in a forest, the cacophony of traffic reduced to a dim hum, squirrels bounding around, birds twittering away above. Such urban respites are plentiful in NYC thanks to its 10,542 acres of forested land, “about half as much as the Congaree Swamp in South Carolina,” notes James Barron at The New York Times, in one of the most densely populated urban areas in the country.
“Most of the city’s forest is deep in parks”—in Central Park, of course, and also Prospect Park and Riverside, and dozens of smaller oases, and the lush Botanical Gardens in the Bronx. The city’s forests are subject to the usual pressures other wooded areas face: climate change, invasive species, etc.
They are also dependent on a well-funded Parks Department and nonprofits like the Natural Areas Conservancy for the preservation and upkeep not only of the large parks but of the trees that shade city streets in all five boroughs.
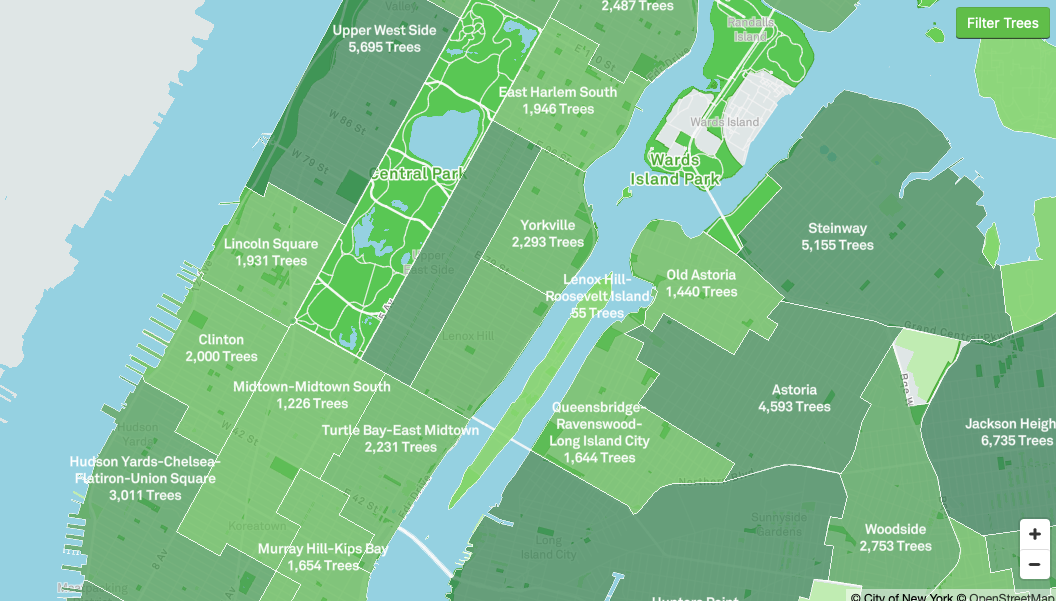
Luckily, the city and nonprofit groups have been working together to plan for what the conservancy’s senior ecologist, Helen Forgione, calls “future forests,” using big data to map out the best paths for urban woodland. The NYC Parks department has been busy compiling figures, and you can find all of their tree stats at the New York City Street Tree Map, which “brings New York City’s urban forest to your fingertips. For the first time,” the Parks department writes, “you have access to information about every street tree in New York City.”
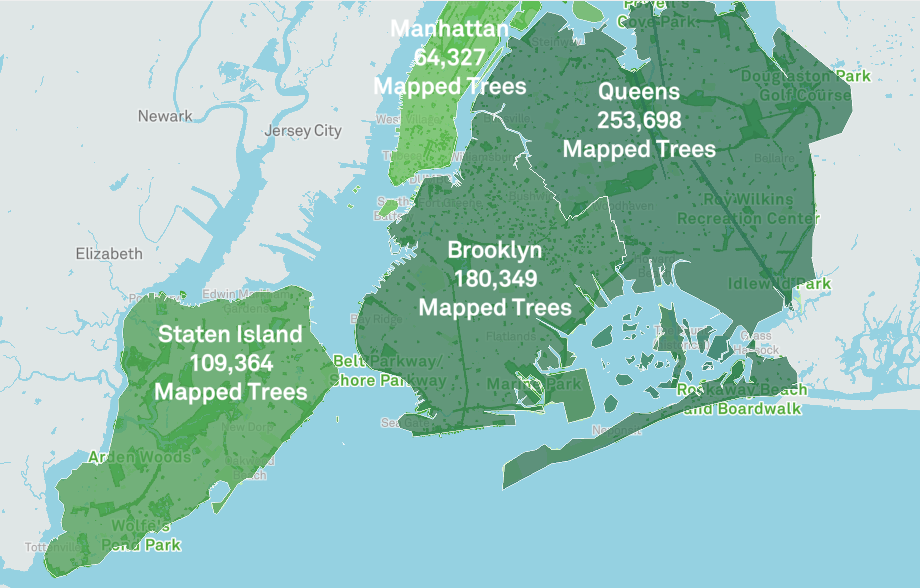
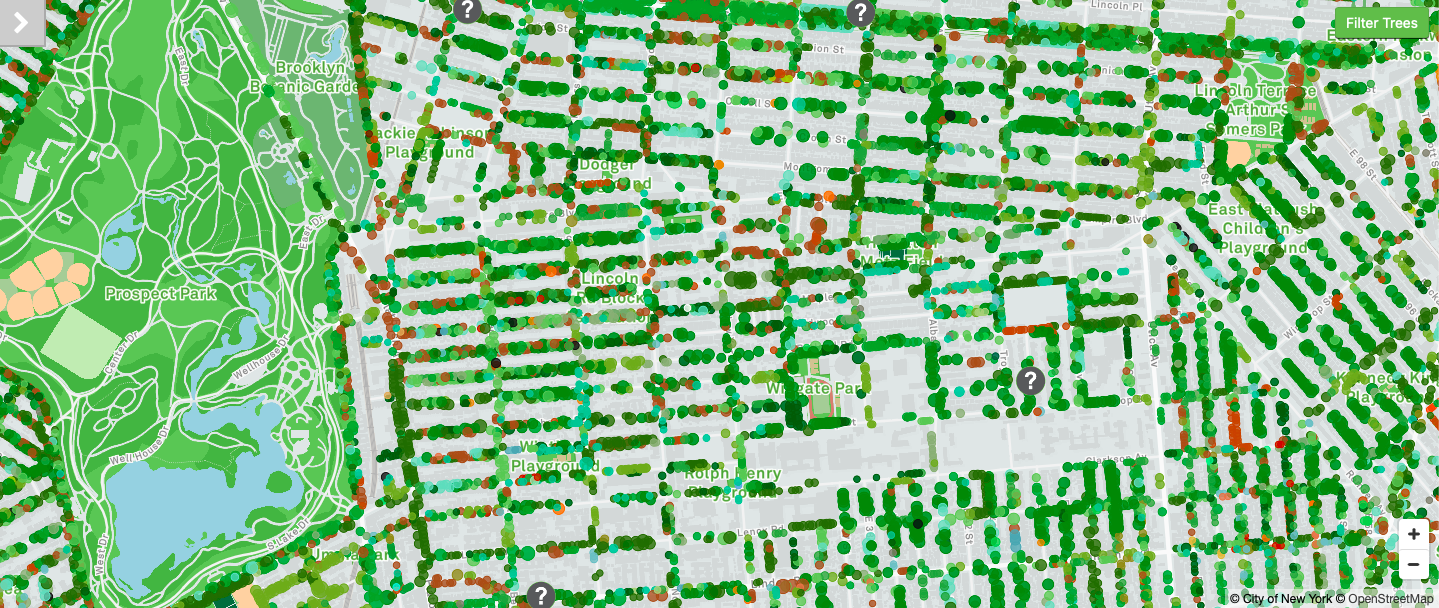
Large forested parks on the interactive map appear as flat green fields—the department has not counted each individual tree in Central Park. But the map gives us fine, granular detail when it comes to street trees, allowing users to zoom in to every intersection and click on colored dots that represent each tree, for example lining Avenue D in the East Village or Flatbush Avenue in Brooklyn. You can search specific locations or comb through citywide statistics for the big picture. At the time of this writing, the project has mapped 694,249 trees, much of that work undertaken by volunteers in the TreesCount! 2015 initiative.
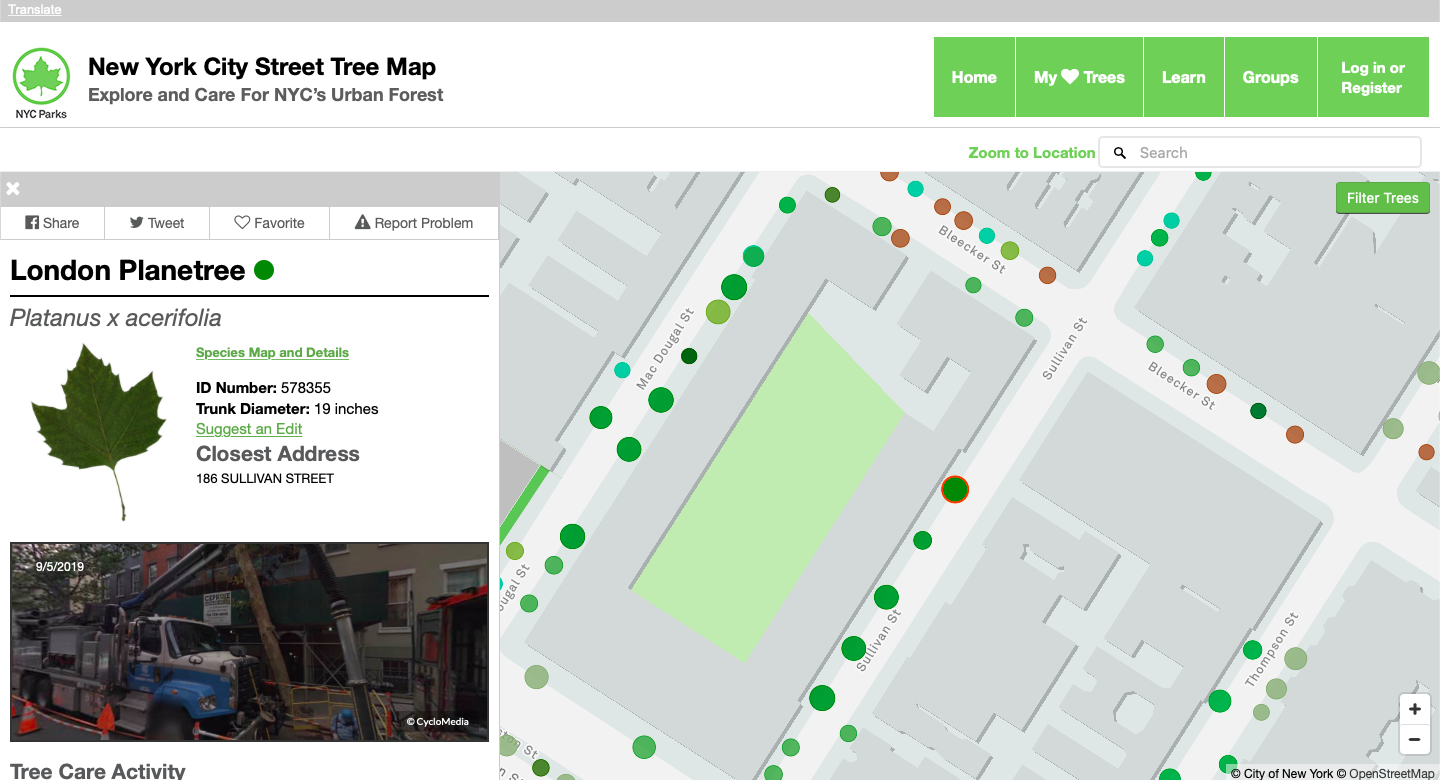
There are many more trees yet to map, and the department’s forestry team updates the site daily. Out of 234 species identified, the most common is the London Planetree, representing 12% of the trees on the map. Other popular species include the Littleleaf Linden, Norway Maple, Pin Oak, and Ginko. Some other stats show the ecological benefits of urban trees, including the amount of energy conserved (667,590,884 kWh, or $84,279,933.06) and amount of carbon dioxide reduced (612,100 tons).
Visit the New York City Street Tree Map for the full, virtual tour of the city’s trees, and marvel—if you haven’t experienced the city’s vibrant tree life firsthand—at just how green the empire city’s streets really are.
Related Content:
New York Public Library Puts 20,000 Hi-Res Maps Online & Makes Them Free to Download and Use
New York City: A Social History (A Free Online Course from N.Y.U.)
Josh Jones is a writer and musician based in Durham, NC. Follow him at @jdmagness
Behold the New York City Street Tree Map: An Interactive Map That Catalogues the 700,000 Trees Shading the Streets of New York City is a post from: Open Culture. Follow us on Facebook, Twitter, and Google Plus, or get our Daily Email. And don't miss our big collections of Free Online Courses, Free Online Movies, Free eBooks, Free Audio Books, Free Foreign Language Lessons, and MOOCs.


from Open Culture https://ift.tt/33ZFlBp
via Ilumina
Comments
Post a Comment