2020 was “a year for the (record) books in publishing,” wrote Jim Milliot in Publisher’s Weekly this past January, a surge continuing into 2021. Yet some kinds of print books have so declined in sales there may be no reason to keep publishing them, or buying them, since their equivalents online are superior in almost every respect to any version on paper. As I finally conceded during a recent, aggressive spring cleaning, I personally have no reason to store heavy, bulky, dusty reference books, except in cases of extreme sentiment.
The online Stanford Encyclopedia of Philosophy, or the SEP, dispensed with the need for philosophy encyclopedias in print years ago. It’s “the most interesting website on the internet,” wrote Nikhail Sonnad at Quartz in 2015. “Not because of the content — which includes fascinating entries on everything from ambiguity to zombies—but because of the site itself. Its creators have solved one of the internet’s fundamental problems: How to provide authoritative, rigorously accurate knowledge, at no cost to readers. It’s something the encyclopedia, or SEP, has managed to do for two decades.”
Started in 1995 by Stanford philosopher Edward Zalta with only two entries, the SEP is “positively ancient in internet years,” but it is hardly “ossified,” remaining an online source “‘comparable in scope, depth and authority,’” the American Library Association’s Booklist review wrote, “to the biggest philosophy encyclopedias in print.”
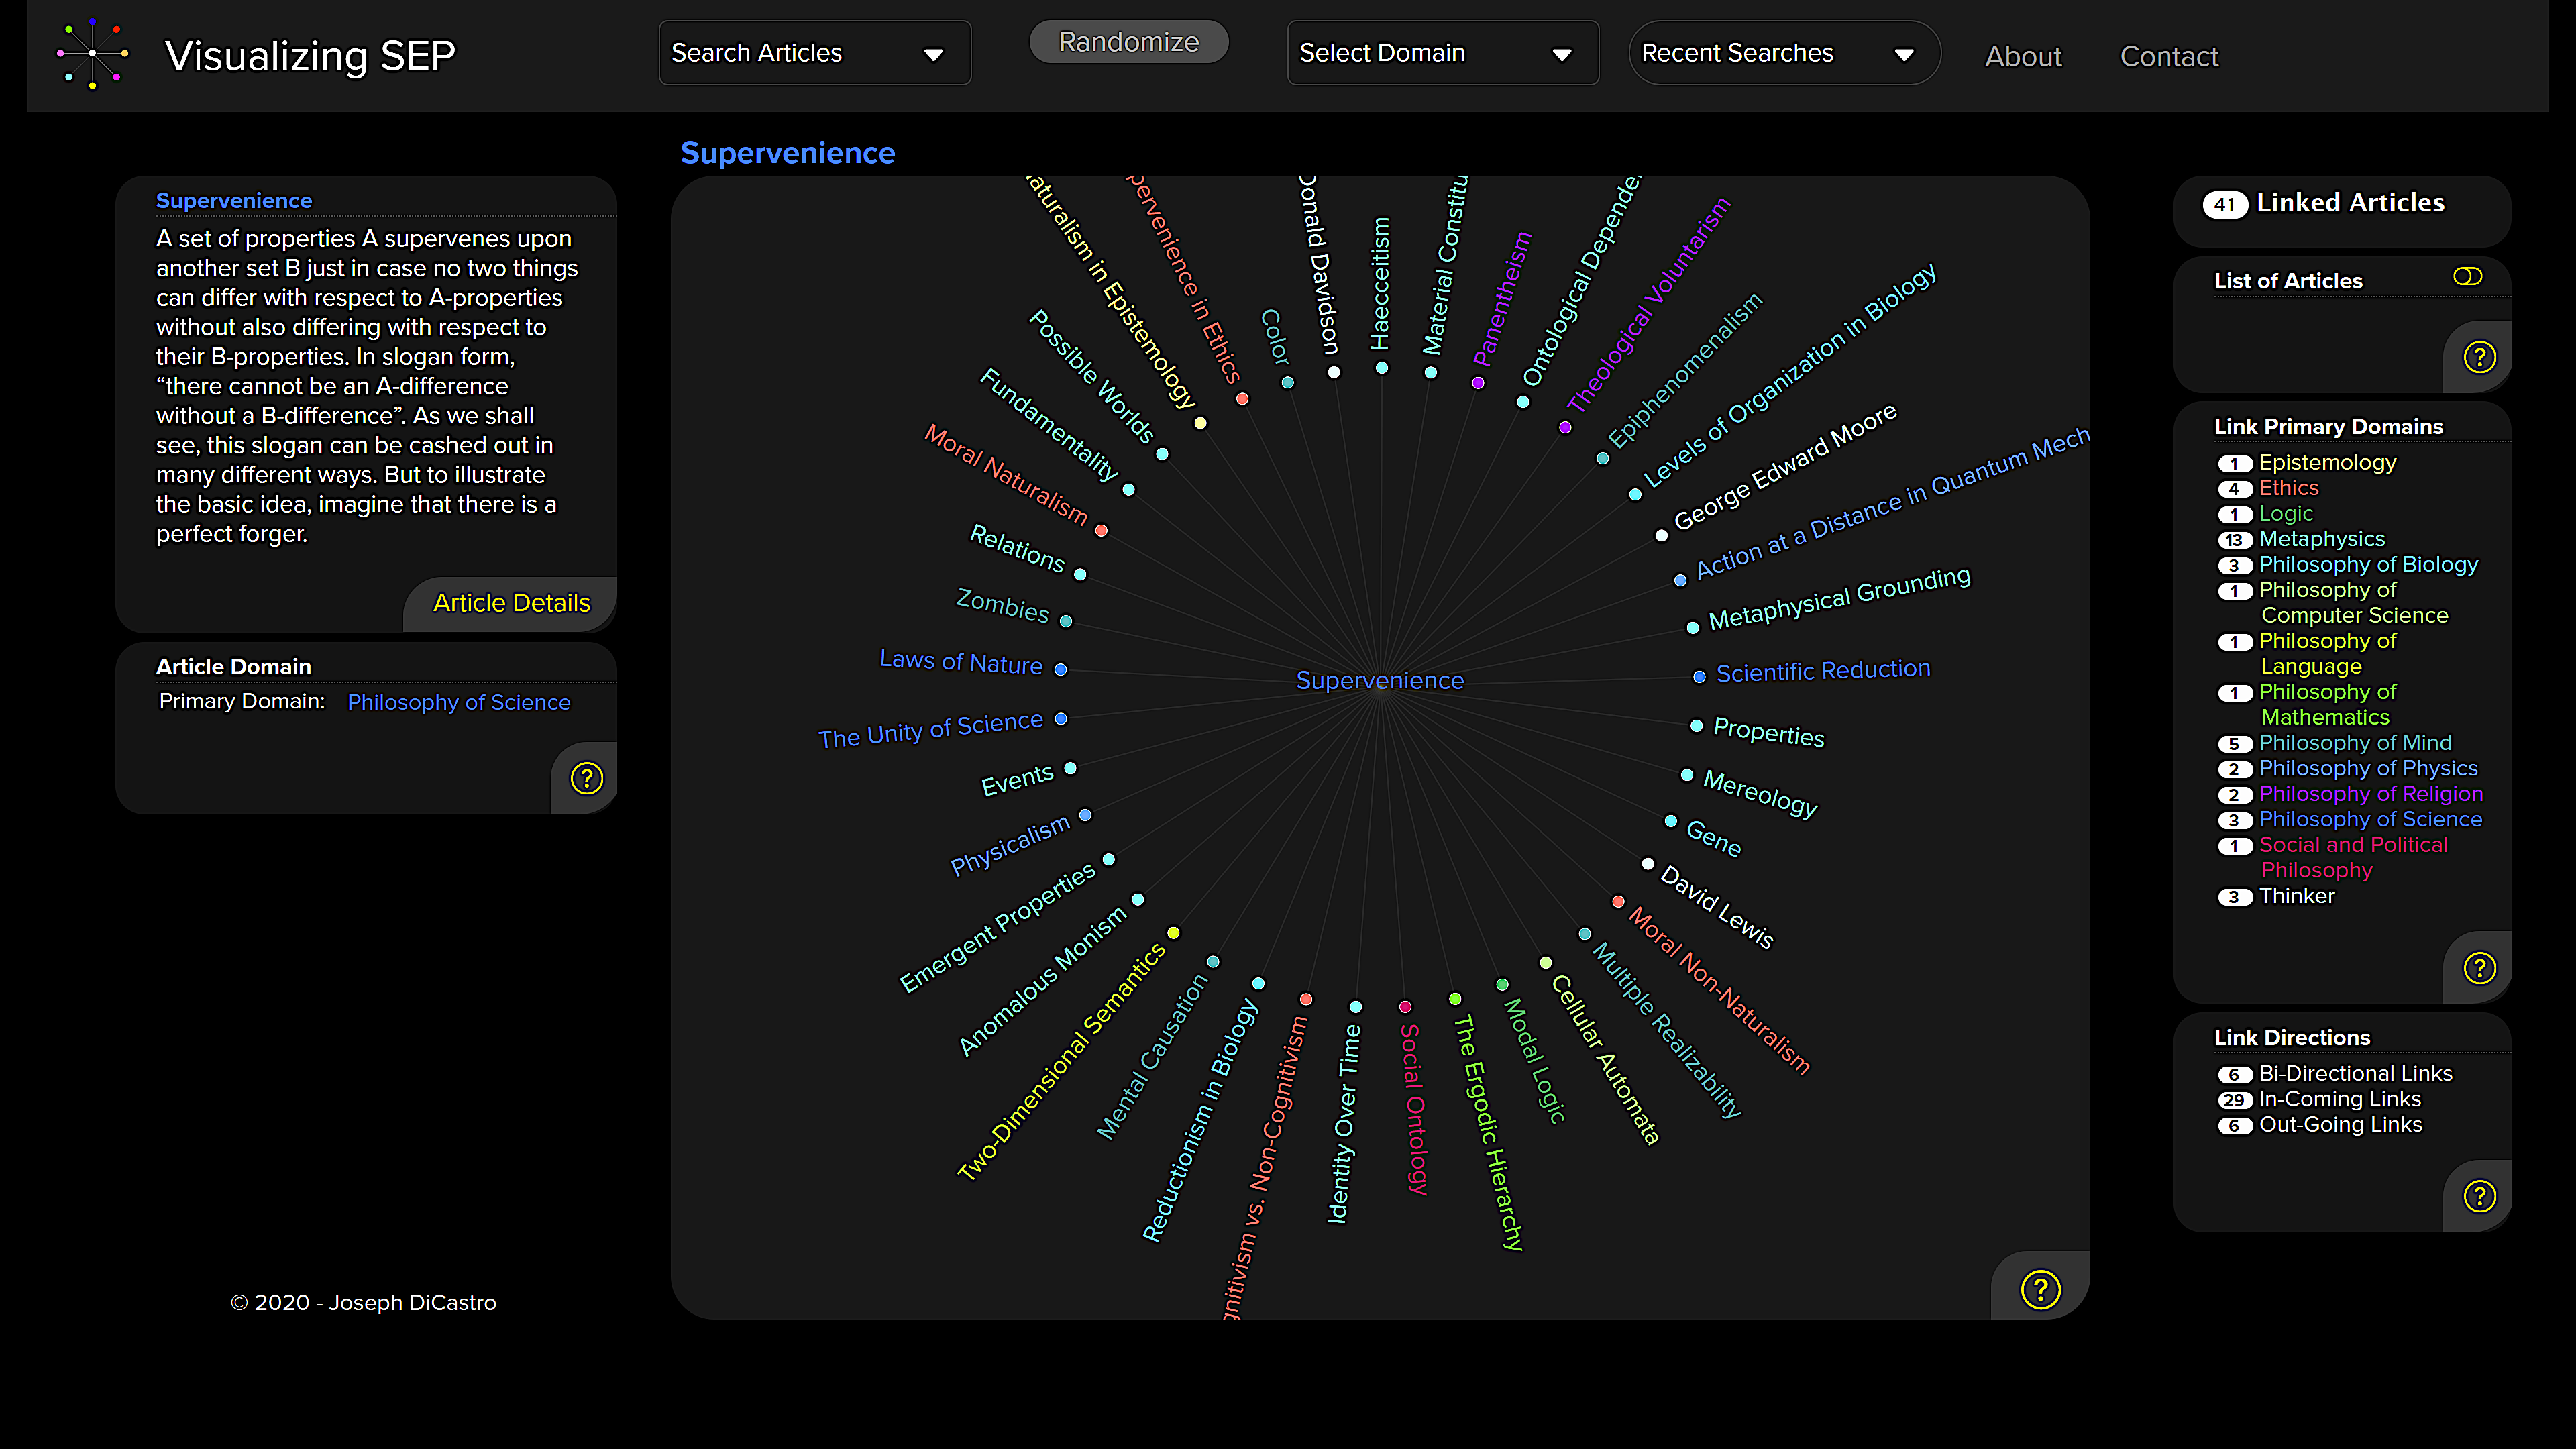
I personally think the SEP is just as interesting for its content as its achievement, if not more so — and now, thanks to engineer and developer Joseph DiCastro, that content is more accessible than ever, though an interactive visualization project and search engine called Visualizing SEP.
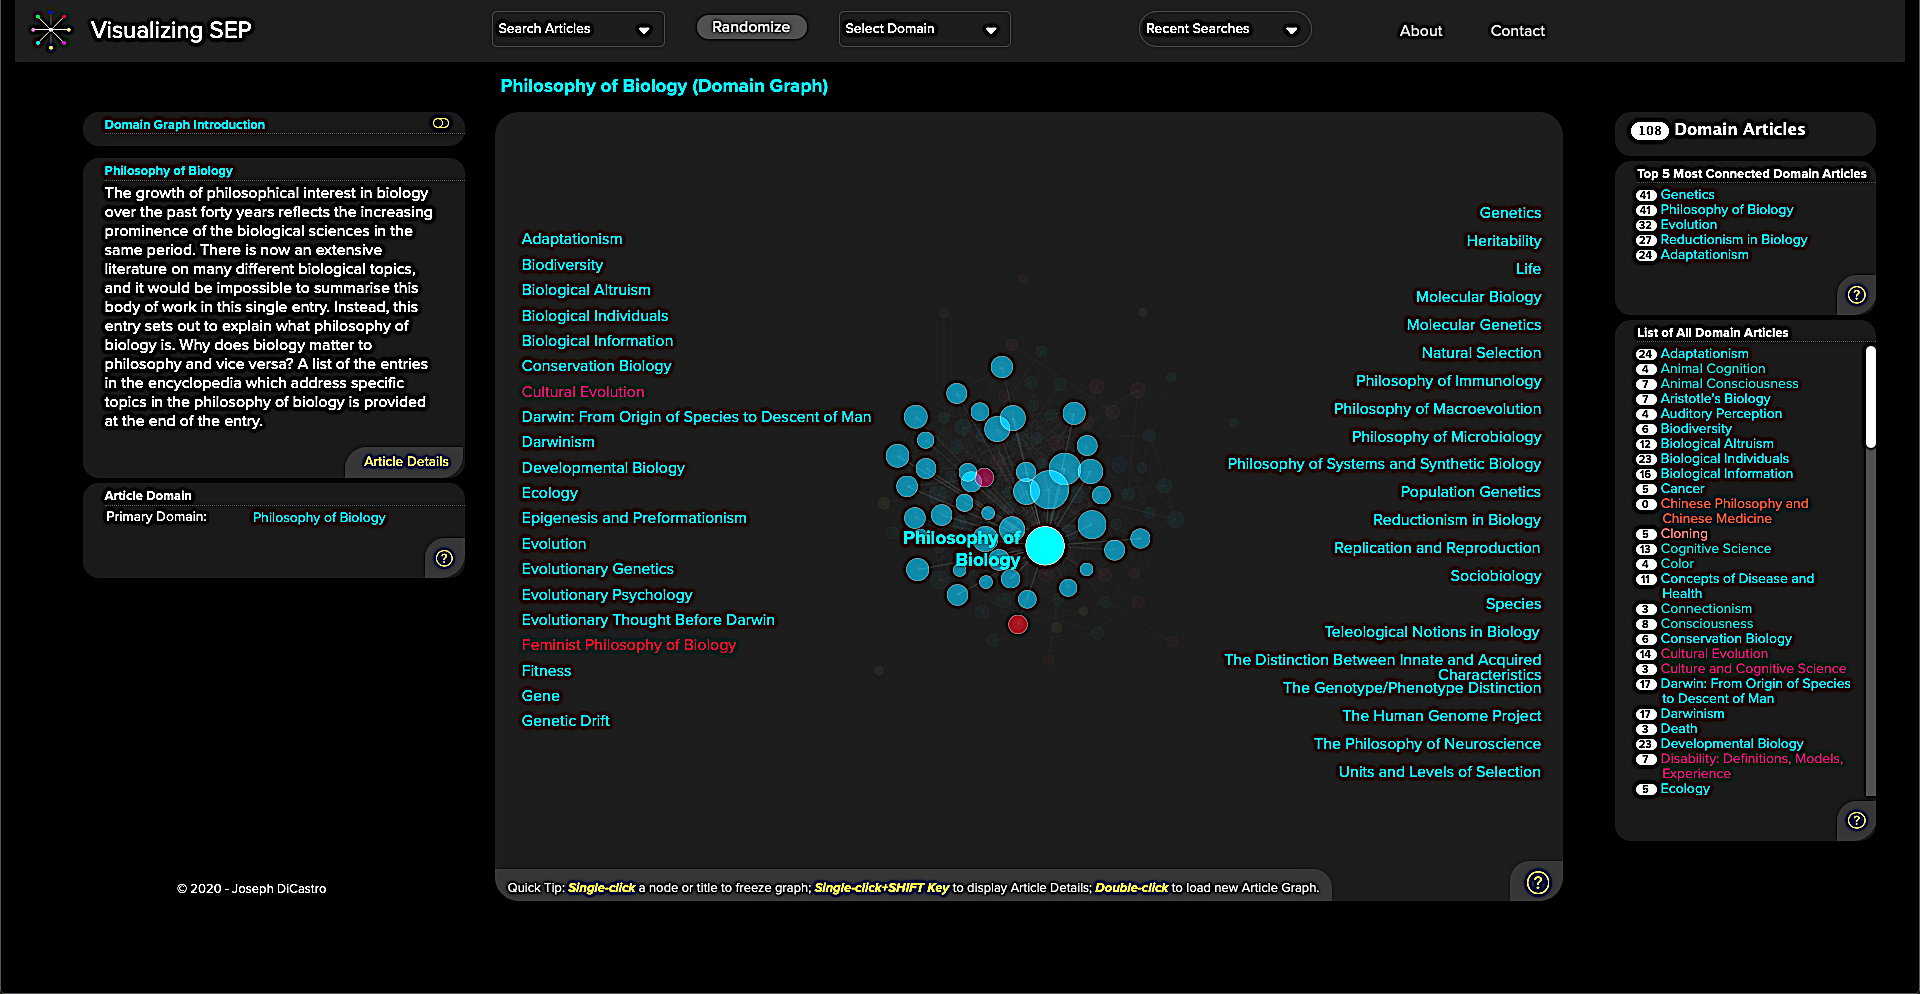
Visualizing SEP “provides clear visualizations based on a philosophical taxonomy that DiCastro adapted from the one developed by the Indiana University Philosophy Ontology Project (InPhO),” Justin Weinberg writes at Daily Nous. “Type a term into the search box and suggested SEP entries will be listed. Click on one of the entry titles, and a simple visualization will appear with your selected entry at the center and related entries surrounding it.” At the top of the page, you can select from a series of “domains.” Each selection produces a similar visualization of various-sized dots.
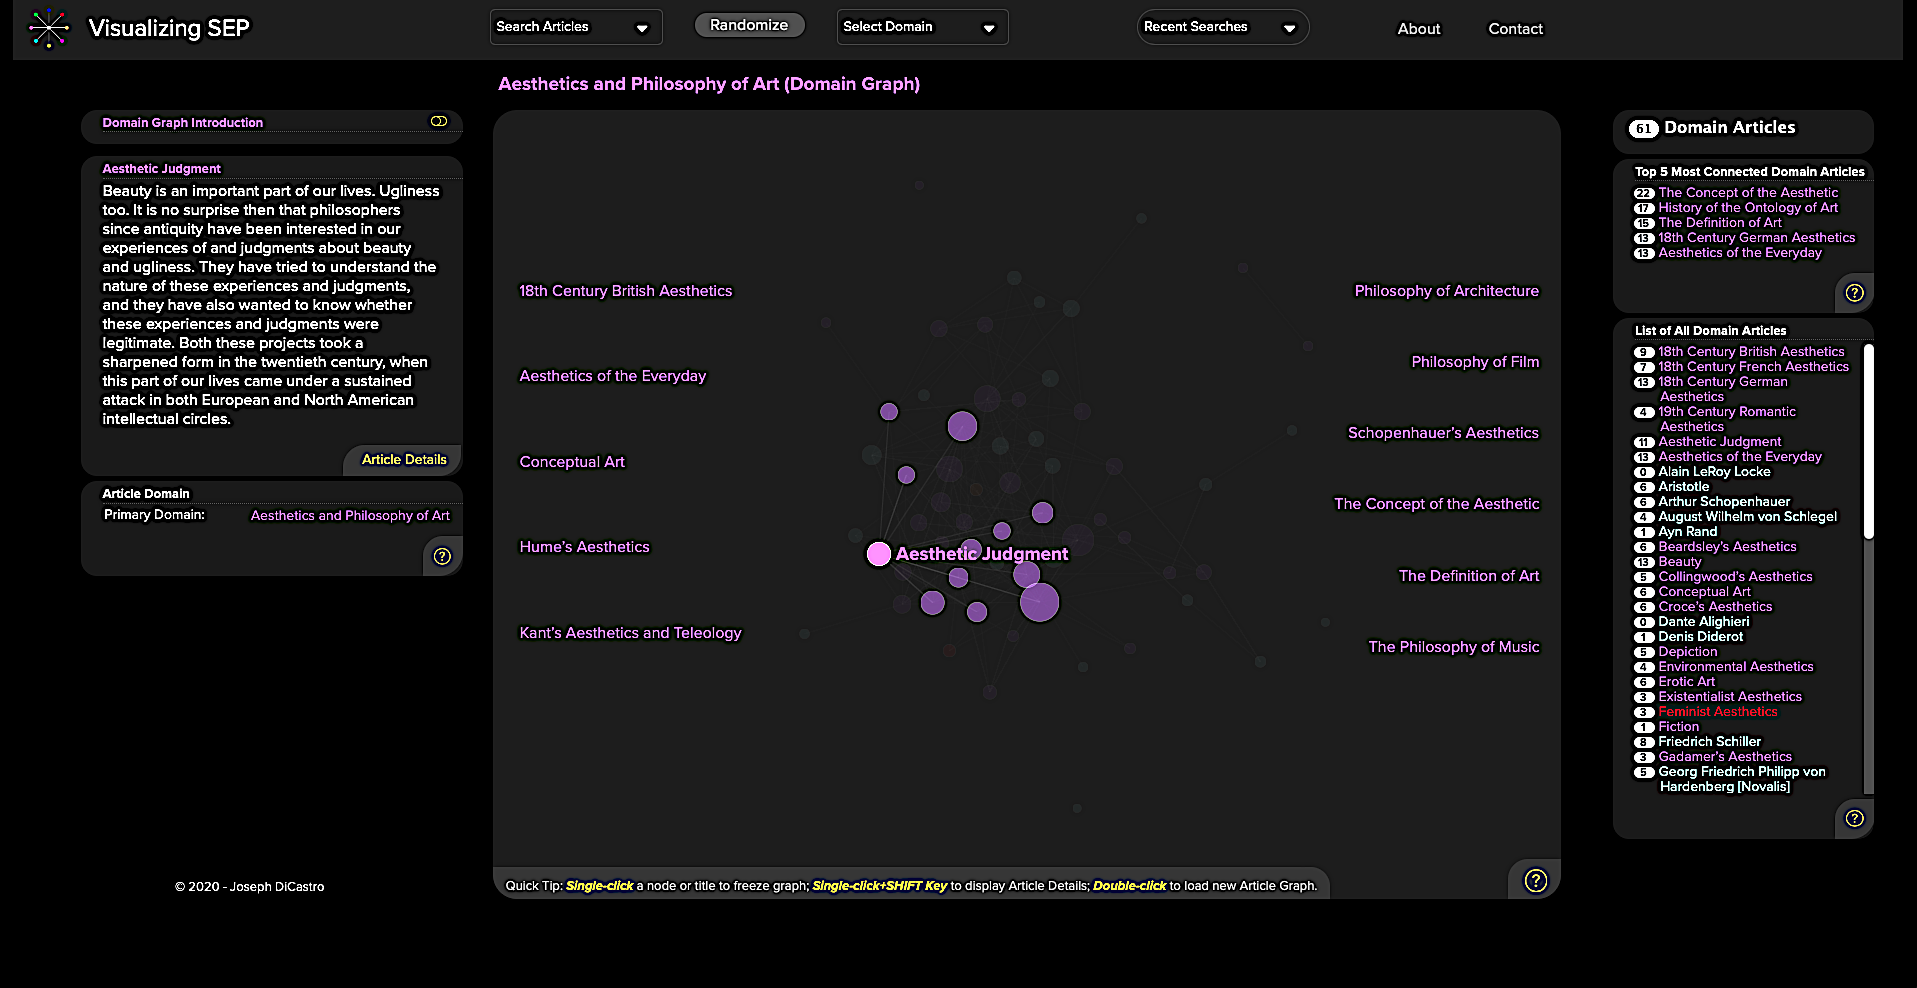
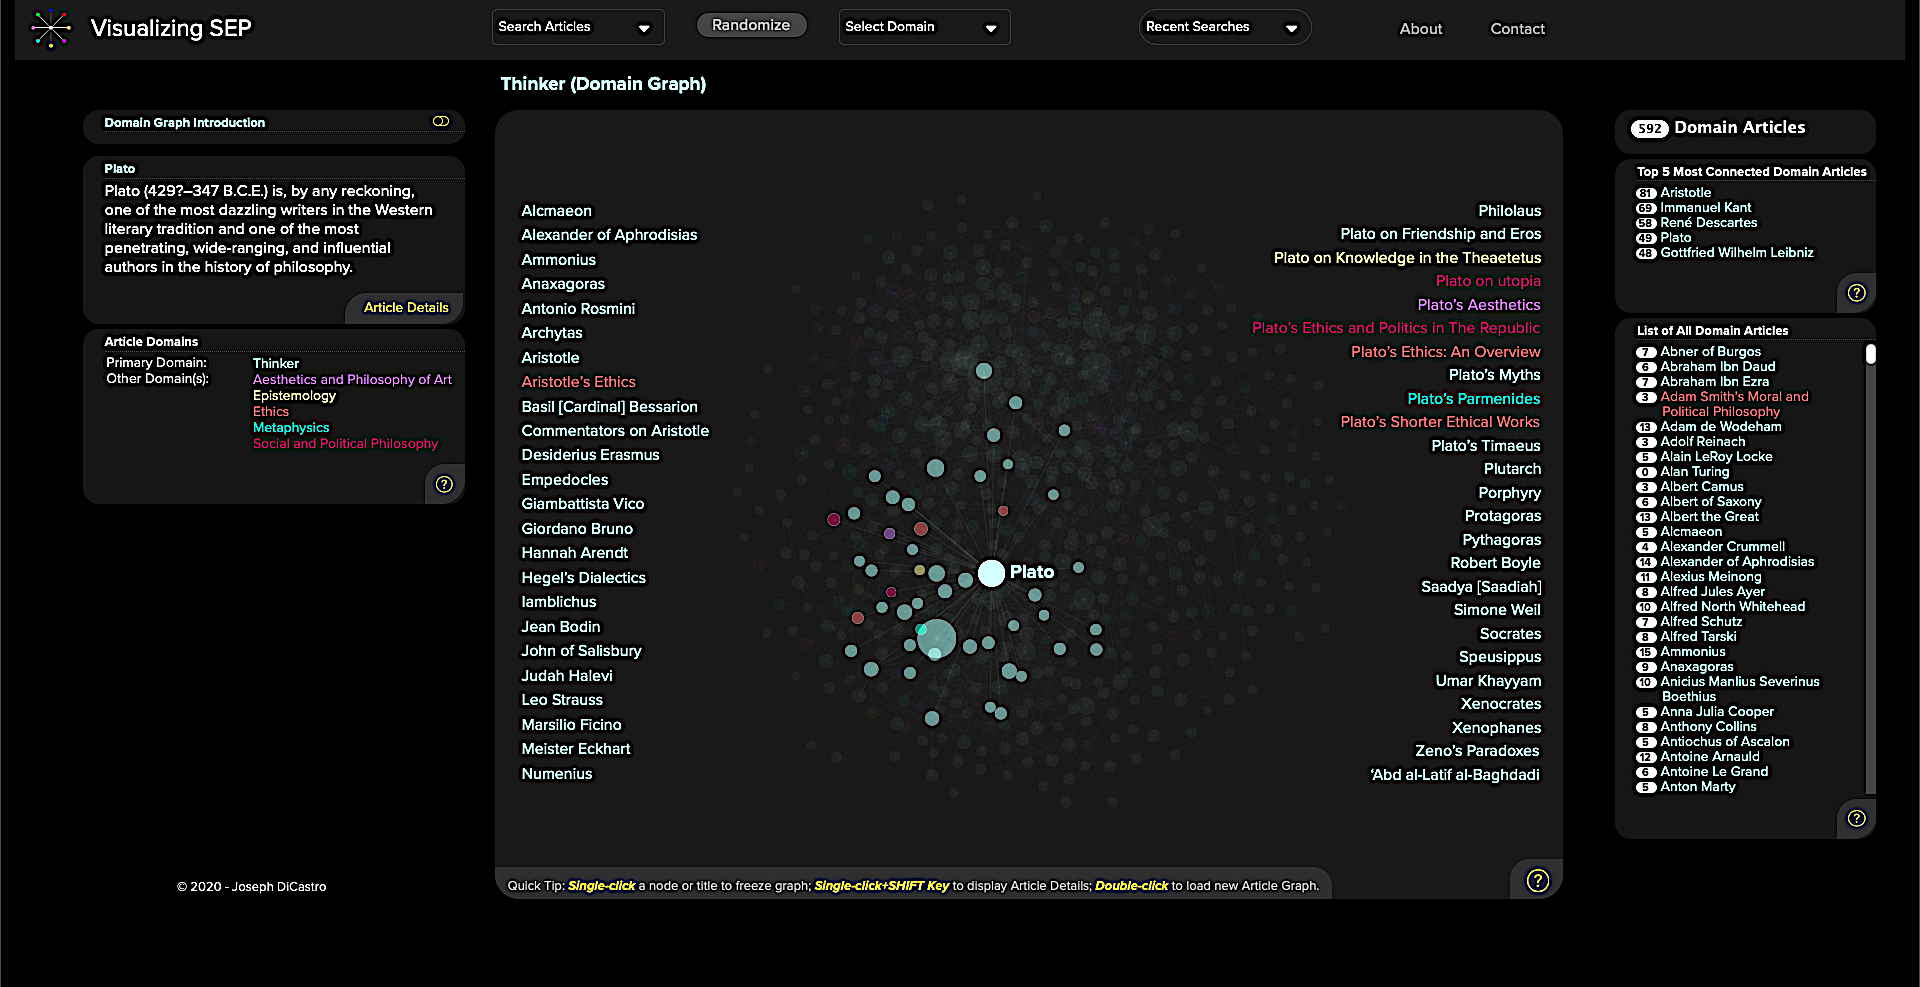
I found enough entries to keep me busy for hours in the very first domain graph, “Aesthetics and Philosophy of Art.” The last of these, simply titled “Thinker,” links together all of the philosophers mentioned in the Stanford Encyclopedia of Philosophy, from the most famous household names to the most obscure and scholastic. Just skimming through these names and reading the brief biographies at the left will leave readers with a broader contextual understanding than they could gain from a print encyclopedia. (Click on the “Article Details” button to expand the full article).
The visualizer project carries forth into the data-obsessed 21st century one of the best things about the Internet in its earliest years: access to free, high quality (and highly portable) information with few barriers for entry. Learn more about how to best navigate Visualizing SEP at Daily Nous.
Related Content:
Free Online Philosophy Courses
A Data Visualization of Modern Philosophy, 1950-2018
The History of Philosophy Visualized in an Interactive Timeline
Josh Jones is a writer and musician based in Durham, NC. Follow him at @jdmagness
An Interactive Visualization of the Stanford Encyclopedia of Philosophy is a post from: Open Culture. Follow us on Facebook and Twitter, or get our Daily Email. And don't miss our big collections of Free Online Courses, Free Online Movies, Free eBooks, Free Audio Books, Free Foreign Language Lessons, and MOOCs.


from Open Culture https://ift.tt/3oA3mKX
via Ilumina
Comments
Post a Comment