Ancient people did not think about history the way most of us do. It made no difference to contemporary readers of the popular Roman historian, Livy (the “JK Rowling of his day”), that “most of the flesh and blood of [his] narrative is fictitious,” and “many of the stories are not really Roman but Greek stories reclothed in Roman dress,” historian Robert Ogilvie writes in an introduction to Livy’s Early History of Rome. Ancient historians did not write to document facts, but to illustrate moral, philosophical, and political truths about what they saw as immutable human nature.
Much of what we know about Roman antiquity comes not from ancient Roman history but from modern archeology (which is still making “amazing” new discoveries about Roman cities). The remains of Rome at its apogee date from the time of Livy, who was likely born in 59 BC and died circa 12 AD. A contemporary, and possibly a friend, of Augustus, the historian lived through a period of immense growth in which the new empire spread across the continent, founding, building, and conquering towns and cities as it went — a time, he wrote, when “the might of an imperial people is beginning to work its own ruin.”
Livy preferred to look back — “turn my eyes from the troubles,” he said — “more than seven hundred years,” to the date long given for the founding of Rome, 753 BC, which seemed ancient enough to him. Modern archeologists have found, however, that the city probably arose hundreds of years earlier, having been continuously inhabited since around 1000 BC. Livy’s own prosperous but provincial city of Padua only became incorporated into the Roman empire a few decades before his birth. According to Livy himself, Padua was first founded in 1183 BC by the Trojan prince Antenor… if you believe the stories….
The point is that ancient Roman dates are suspect when they come from literary sources (or “histories”) rather than artifacts and archaeological dating methods. What is the distribution of such dates across articles about ancient Rome on Wikipedia? Who could say. But the sheer number of documents and artifacts left behind by the Romans and the people they conquered and subdued make it easy to reconstruct the historical strata of European cities — though we should allow for more than a little exaggeration, distortion, and even fiction in the data.
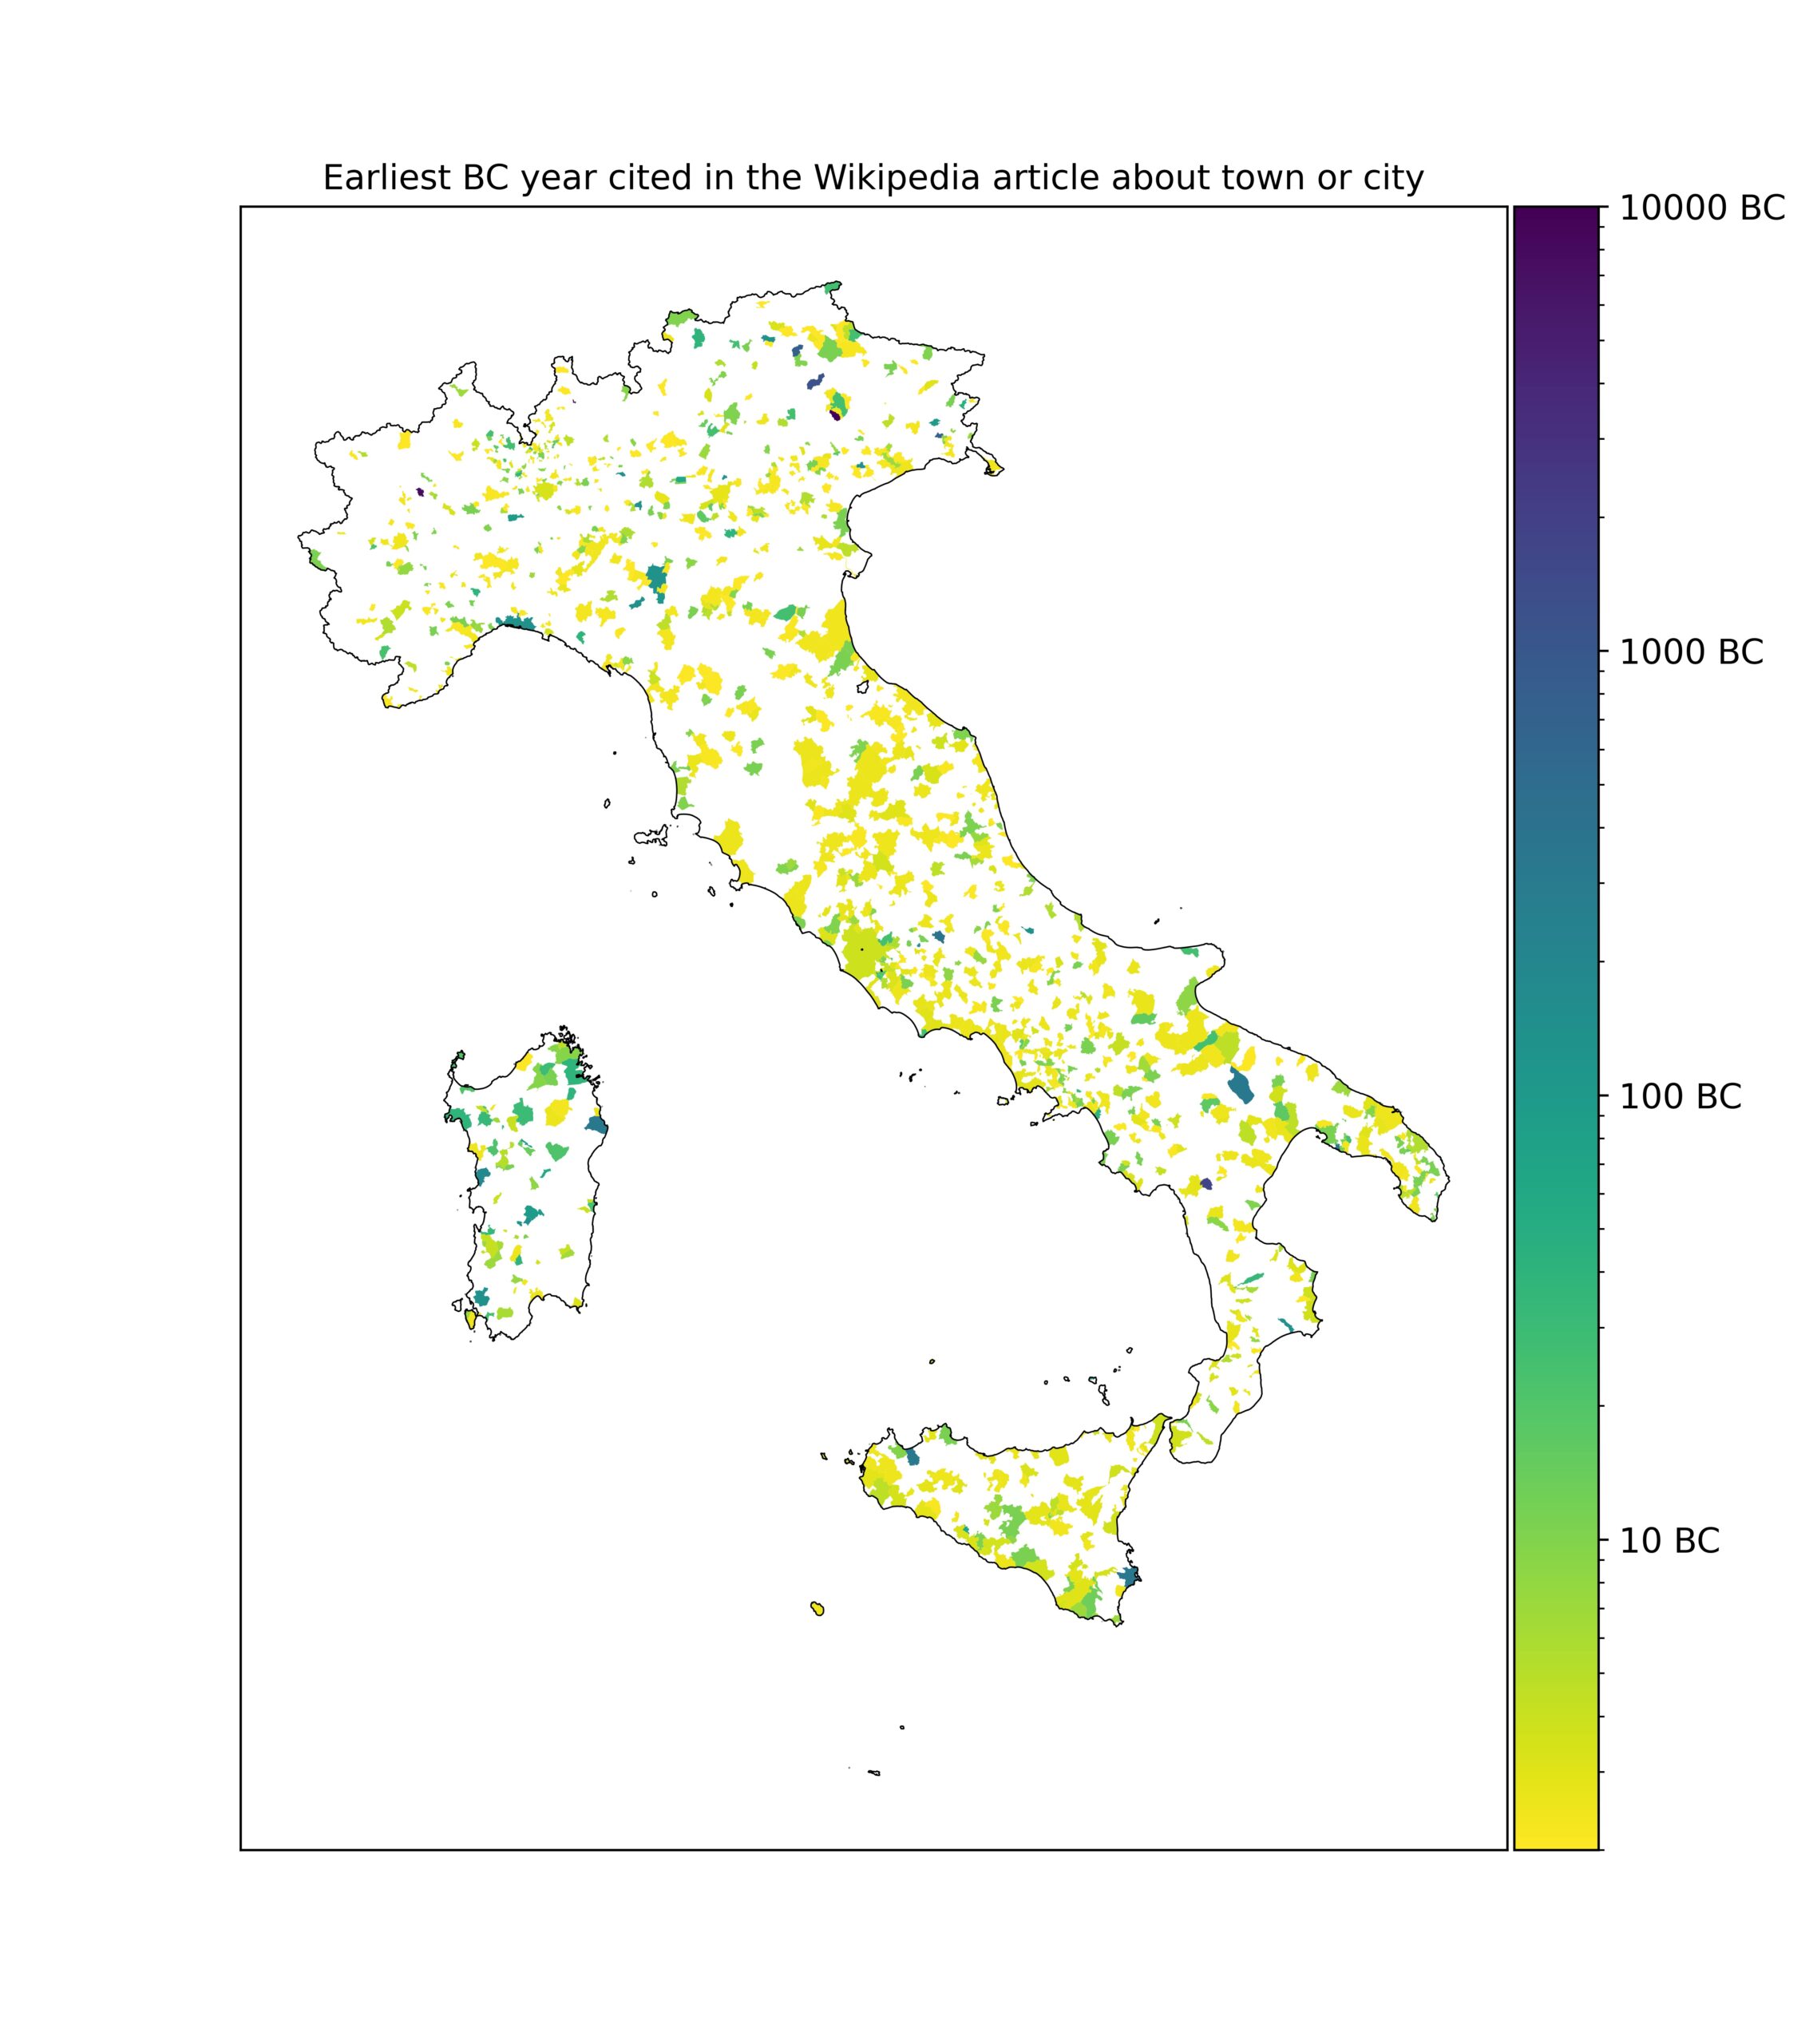
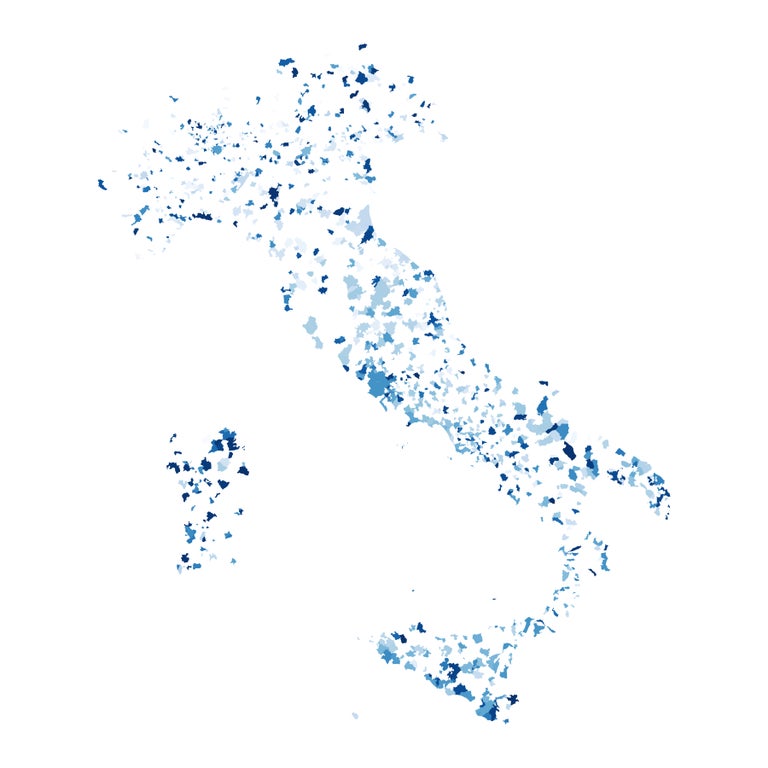
The maps you see here use Wikipedia data to visualize towns and cities in modern-day Italy founded before the first century — that is, every Italian settlement of any kind with a “BC” cited in its associated article. Many of these were founded by the Romans in the 2nd or 3rd century BC. Many cities, like Pompeii, Milan, and Livy’s own Padua, were conquered or slowly taken over from earlier peoples. Another version of the visualization, above, shows a distribution by color of the dates from 10,000 BC to 10 BC. It makes for an equally striking way to illustrate the history, and prehistory, of Italy up to Livy’s time — that is, according to Wikipedia.
The creator of the visualizations obtained the data by scraping 8000 Italian Wikipedia articles for mentions of “BC” (or “AC” in Italian). Even if we all agreed the open online encyclopedia is an authoritative source (and we certainly do not), we’d still be left with the problem of ancient dating in creating an accurate map of ancient Roman and Italian history. Unreliable data does not improve in picture form. But data visualizations can, when combined with careful scholarship and good research, make dry lists of numbers come alive, as Livy’s stories made Roman history, as he knew it, live for his readers.
See the creator’s dataset below and learn more here.
count 1152
mean 929.47
std 1221.89
min 2
25% 196
50% 342.5
75% 1529.5
max 10000
Related Content:
The Roads of Ancient Rome Visualized in the Style of Modern Subway Maps
Rome’s Colosseum Will Get a New Retractable Floor by 2023 — Just as It Had in Ancient Times
Josh Jones is a writer and musician based in Durham, NC. Follow him at @jdmagness
A Data Visualization of Every Italian City & Town Founded in the BC Era is a post from: Open Culture. Follow us on Facebook and Twitter, or get our Daily Email. And don't miss our big collections of Free Online Courses, Free Online Movies, Free eBooks, Free Audio Books, Free Foreign Language Lessons, and MOOCs.


from Open Culture https://ift.tt/3567aL3
via Ilumina
Comments
Post a Comment