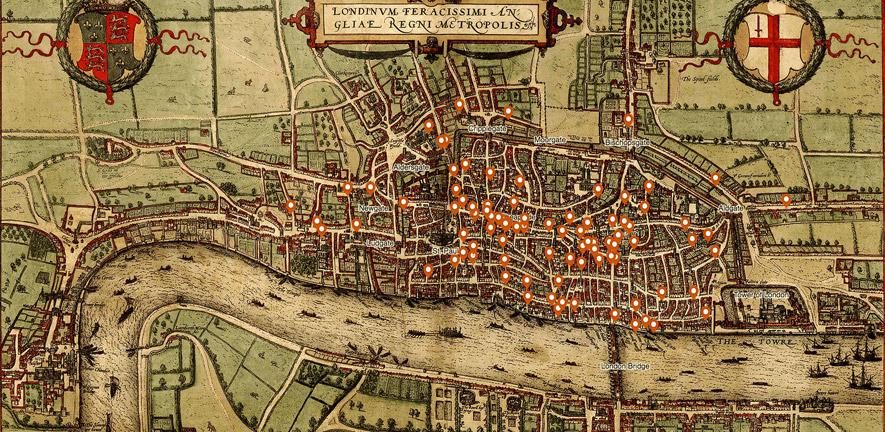
How dangerous was medieval London? That’s a question that has recently been studied by the University of Cambridge’s Violence Research Center, and they have provided a handy interactive map for our perusal. Just in case we go back in time in a TARDIS or some such machine, we’ll know what parts of the city to avoid. And those parts are...well, most of it, actually.
The data containing info of 142 homicides comes from surviving coroner’s rolls from the first half of the 14th century. A coroner during this time was a bit closer to a police detective in ours, called to the scene of any sudden and unnatural death. And if it looked liked foul play a neighborhood jury of somewhere between 12 and 50 people were called to offer a verdict.
Hover over a marker on the map and you can discover what happened at that location. Here are a few examples:
On the evening of July 20, 1325, Peter Clark, a baker, was stabbed in the heart by a fellow baker called Walter after an argument. Walter took sanctuary in a church, confessed to the crime, and a month later made his way out of the country by boat.
On December 21, 1325, Roger Scott, a tailor, was quarreling with Robert de Oundle in the streets of Bishopgate, when Robert stabbed Roger with a hidden knife, killing him instantly. He also fled, to where nobody knew.
On February 13, 1324, William Warrock and William de Northamptone were arguing in the high street of Castle Baynard, when the former stabbed the latter in the heart. Warrock, who had no belongings, disappeared.
Sensing a theme here? We’ll never know the reason for these fatal altercations, but the knife industry was doing well out of it. The study crunched the numbers and found some statistics: the time of year did not seem to be a factor, but like today, the weekend was a deadlier time. And the hours between early evening and the first hour of London’s curfew, when the city insisted all fires be extinguished and people go to bed.
A whopping 52% of murders happened in the public square or the high street. No other location cracks 10%. And long knives were the weapon of choice at 35%, second only to short knives at 20%. And though it wasn’t reflected in the three random examples, most people got stabbed in the head. Unsurprisingly men committed the majority of the crimes, and all classes of society and profession murdered their way around London, including priests. (One example is given of a priest who stabs a gardener to death when the latter discovered him stealing apples.)
Professor and criminologist Manuel Eisner summed up the work of his group thus:
“The events described in the Coroners’ Rolls show weapons were never far away, male honour had to be protected, and conflicts easily got out of hand. They give us a detailed picture of how homicide was embedded in the rhythms of urban medieval life.”
And in fact, given the proportion of crime to the general population, London was pretty deadly, about 15-20 times higher than a modern British city.
But Eisner notes the comparisons can only go so far: “We have firearms, but we also have emergency services. It’s easier to kill but easier to save lives.”
Visit the interactive medieval murder map here.
Related Content:
An Interactive Map Shows Just How Many Roads Actually Lead to Rome
An Interactive Map of Odysseus’ 10-Year Journey in Homer’s Odyssey
Ted Mills is a freelance writer on the arts who currently hosts the artist interview-based FunkZone Podcast and is the producer of KCRW's Curious Coast. You can also follow him on Twitter at @tedmills, read his other arts writing at tedmills.com and/or watch his films here.
New Interactive “Murder Map” Reveals the Meanest Streets of Medieval London is a post from: Open Culture. Follow us on Facebook, Twitter, and Google Plus, or get our Daily Email. And don't miss our big collections of Free Online Courses, Free Online Movies, Free eBooks, Free Audio Books, Free Foreign Language Lessons, and MOOCs.


from Open Culture http://bit.ly/2WAhLal
via Ilumina
Comments
Post a Comment