It certainly may not feel like things are getting better behind the anxious veils of our COVID lockdowns. But some might say that optimism and pessimism are products of the gut, hidden somewhere in the bacterial stew we call the microbiome. “All prejudices come from the intestines,” proclaimed noted sufferer of indigestion, Friedrich Nietzsche. Maybe we can change our views by changing our diet. But it’s a little harder to change our emotions with facts. We turn up our noses at them, or find them impossible to digest.
Nietzsche did not consider himself a pessimist. Despite his stomach troubles, he “adopted a philosophy that said yes to life,” notes Reason and Meaning, “fully cognizant of the fact that life is mostly miserable, evil, ugly, and absurd.” Let’s grant that this is so. A great many of us, I think, are inclined to believe it. We are ideal consumers for dystopian Nietzsche-esque fantasies about supermen and “last men.” Still, it's worth asking: is life always and equally miserable, evil, ugly, and absurd? Is the idea of human progress no more than a modern delusion?
Physician, statistician, and onetime sword swallower Hans Rosling spent several years trying to show otherwise in television documentaries for the BBC, TED Talks, and the posthumous book Factfulness: Ten Reasons We’re Wrong About the World—and Why Things Are Better Than You Think, co-written with his son and daughter-in-law, a statistician and designer, respectively. Rosling, who passed away in 2017, also worked with his two co-authors on software used to animate statistics, and in his public talks and book, he attempted to bring data to life in ways that engage gut feelings.
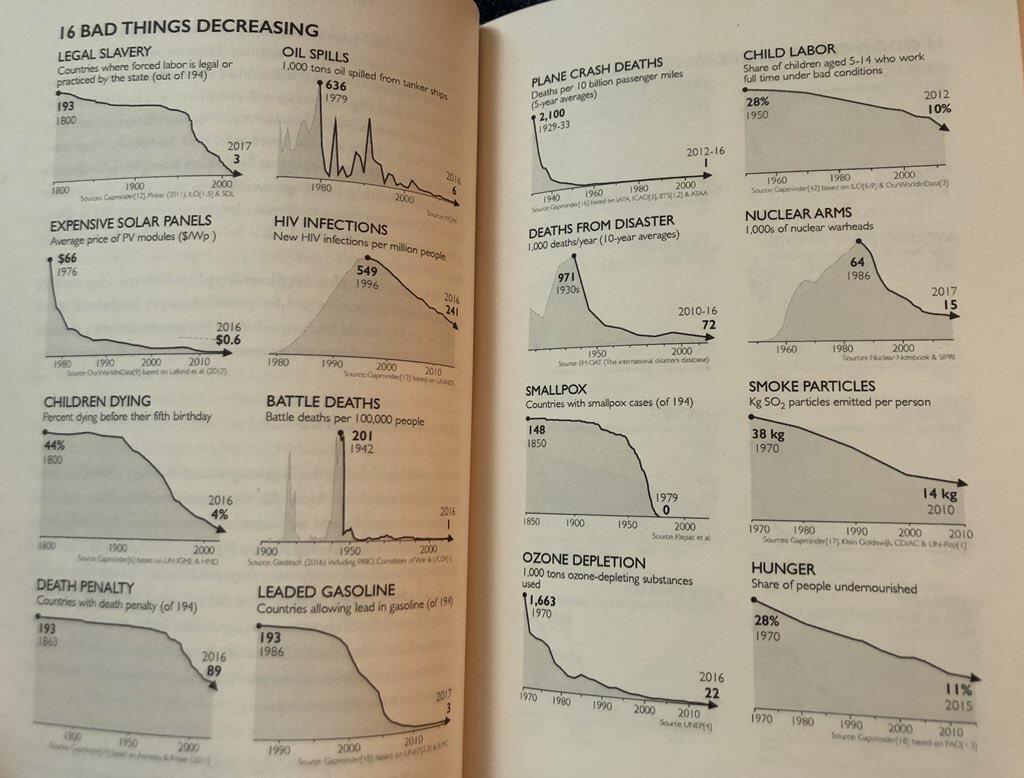
Take the set of graphs above, aka, “16 Bad Things Decreasing,” from Factfulness. (View a larger scan of the pages here.) Yes, you may look at a set of monochromatic trend lines and yawn. But if you attend to the details, you'll can see that each arrow plummeting downward represents some profound ill, manmade or otherwise, that has killed or maimed millions. These range from legal slavery—down from 194 countries in 1800 to 3 in 2017—to smallpox: down from 148 countries with cases in 1850 to 0 in 1979. (Perhaps our current global epidemic will warrant its own triumphant graph in a revised edition some decades in the future.) Is this not progress?

What about the steadily falling rates of world hunger, child mortality, HIV infections, numbers of nuclear warheads, deaths from disaster, and ozone depletion? Hard to argue with the numbers, though as always, we should consider the source. (Nearly all these statistics come from Rosling’s own company, Gapminder.) In the video above, Dr. Rosling explains to a TED audience how he designed a course on global health in his native Sweden. In order to make sure the material measured up to his accomplished students’ abilities, he first gave them a questionnaire to test their knowledge.
Rosling found, he jokes, “that Swedish top students know statistically significantly less about the world than a chimpanzee," who would have scored higher by chance. The problem “was not ignorance, it was preconceived ideas," which are worse. Bad ideas are driven by many -isms, but also by what Rosling calls in the book an “overdramatic” worldview. Humans are nervous by nature. “Our tendency to misinterpret facts is instinctive—an evolutionary adaptation to help us make quick decisions to avoid danger,” writes Katie Law in a review of Factfulness.
“While we still need these instincts, they can also trip us up.” Magnified by global, collective anxieties, weaponized by canny mass media, the tendency to pessimism becomes reality, but it's one that is not supported by the data. This kind of argument has become kind of a cottage industry; each presentation must be evaluated on its own merits. Presumably enlightened optimism can be just as oversimplified a view as the darkest pessimism. But Rosling insisted he wasn’t an optimist. He was just being “factful.” We probably shouldn’t get into what Nietzsche might say to that.
Related Content:
Positive Psychology: A Free Course from Harvard University
Josh Jones is a writer and musician based in Durham, NC. Follow him at @jdmagness
16 Ways the World Is Getting Remarkably Better: Visuals by Statistician Hans Rosling is a post from: Open Culture. Follow us on Facebook, Twitter, and Google Plus, or get our Daily Email. And don't miss our big collections of Free Online Courses, Free Online Movies, Free eBooks, Free Audio Books, Free Foreign Language Lessons, and MOOCs.


from Open Culture https://ift.tt/3fHWbM0
via Ilumina
Comments
Post a Comment